



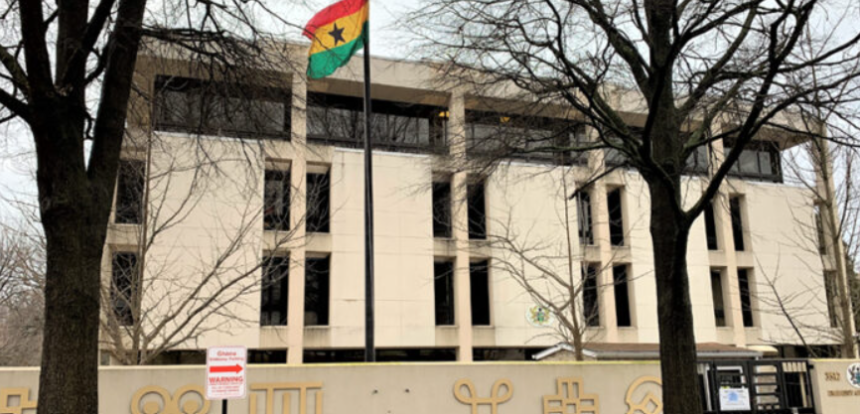
An Assessment of Embassy Responsiveness in the United States
Abstract
Diplomatic missions are expected to serve as accessible points of contact for citizens abroad, diaspora communities, and international travelers. This study examines whether that expectation holds in practice. The African Diplomatic Accessibility Index (ADAI) assessed the real-world responsiveness of 20 African embassies and consulates in the United States, using standardized phone and email inquiries directed to officially listed contact channels.
Each mission was contacted multiple times across both channels. Three indicators were measured: email response rate, call answer rate, and a composite accessibility score derived from the average of both. Findings indicate significant and widespread accessibility gaps. Seven of the 20 missions recorded composite scores of 0%, meaning no successful contact was made through any channel throughout the study period. Only two countries, Egypt and Kenya, achieved composite scores above 60%. The study also includes a supplementary assessment of 10 Ghanaian missions across Europe, Asia, and Oceania, which revealed similarly inconsistent patterns of responsiveness.
These findings suggest that diplomatic accessibility is not determined by institutional presence alone. Management practices, communication infrastructure, and accountability mechanisms appear to play a significant role. The study argues that responsiveness is not a secondary function of diplomatic missions but a core measure of their effectiveness.
1. Introduction
For citizens living or travelling abroad, the ability to reach their country’s embassy is rarely a matter of preference. It is often a matter of necessity. Visa queries, emergency consular assistance, document authentication, and legal support all depend on the same basic requirement: that someone on the other side of the phone or email answers.
In theory, African diplomatic missions in the United States exist precisely to provide this kind of support. In practice, the quality and consistency of that support vary considerably, and in some cases, appears to be entirely absent. The African Diplomatic Accessibility Index was developed to test this gap directly, not by reviewing stated policy or institutional mandates, but by measuring actual performance through real contact attempts.
This study asks a deceptively simple question: when an ordinary person tries to reach their embassy through officially listed contact channels, do they get through? The answer, as the findings reveal, is often no.
The significance of this question extends beyond individual inconvenience. Diplomatic accessibility is a practical measure of how states engage with citizens beyond their borders. Missions that cannot be reached are missions that cannot serve, and the consequences of that failure fall disproportionately on people with the most urgent needs.
2. Literature Review
The study of diplomatic effectiveness has traditionally concentrated on high-level functions: treaty negotiation, trade facilitation, political representation, and security cooperation. Less attention has been given to the everyday consular and citizen-facing dimensions of embassy performance, which remain underexamined in both policy literature and academic research.
Where consular services have been studied, findings consistently point to disparities in service quality and accessibility. Embassy responsiveness may be influenced by the financial and administrative capacity of the sending state. Diplomatic studies suggest that differences in resources and institutional capacity can contribute to variations in service quality and responsiveness across diplomatic missions (Hamilton & Langhorne, 2011; Sharp, 2009).
Research on African diplomatic infrastructure has highlighted a gap between the growing size of African diaspora communities and the institutional capacity of missions to serve them. The African diaspora in the United States represents millions of individuals from across the continent, yet few systematic studies have evaluated whether the missions serving them are functionally accessible.
The variation in responsiveness observed among African embassies may reflect broader challenges identified in the e-government literature. Ndou (2004) and Heeks (2002) argue that the effectiveness of digital public services depends on institutional capacity, organizational readiness, and administrative support, which can result in differing levels of responsiveness across public institutions.
There is a notable absence of field-based research that tests diplomatic accessibility directly through simulated citizen contact. Most assessments rely on surveys, institutional audits, or self-reported data from governments. This study addresses that gap by adopting a mystery-contact methodology, contacting missions as ordinary citizens would, using only publicly available channels and making no prior arrangement with the missions being assessed.
3. Methodology
Study Design
This study employs a field-based, observational design. Rather than relying on self-reported data or official records, accessibility was measured through direct contact attempts with each mission, simulating the experience of a citizen or traveler seeking consular information.
Sample Selection
Twenty African diplomatic missions in the United States were selected for inclusion. The selection criteria were designed to ensure both practical relevance and regional balance:
- Diaspora presence: Countries with significant diaspora communities in the United States were prioritized, reflecting the level of citizen demand placed on missions.
- Economic and tourism significance: Countries with established trade, investment, or travel links to the United States were included.
- Regional representation: The sample spans West, East, North, Southern, and Central Africa to allow for a continent-wide assessment rather than a regionally skewed one.
- Population size: Larger countries were weighed in the selection to reflect the scale of potential demand.
Data Collection
All contact attempts were made using officially listed phone numbers and email addresses sourced from embassy websites and government-affiliated directories. No private or informally obtained contact details were used, ensuring that the assessment reflects the experience of an ordinary citizen relying on publicly accessible information.
Each mission was contacted through two channels:
- Phone calls: Testing real-time responsiveness and the ability to reach a member of staff during business hours.
- Email inquiries: Evaluating written follow-up communication, using a standardized inquiry regarding visa and consular services.
To reflect the persistence typically required of citizens in real situations, each mission was contacted on multiple occasions where an initial attempt went unanswered. All contact was made within standard working hours, across a defined observation window.
Measurement
Three indicators were derived from the contact data:
- Email Response Rate: the proportion of email attempts that received a substantive reply.
- Call Answer Rate: the proportion of phone calls that were successfully answered by a member of staff.
- Composite Accessibility Score: the mean of both rates, providing a single summary measure of overall accessibility.
Limitations
The following limitations should be considered when interpreting the findings:
- Temporal scope: Contact attempts were conducted within a fixed observation period. Mission responsiveness may vary across different times of year, particularly around public holidays or staffing changes.
- Single-country focus: All missions assessed are located in the United States. Findings may not be generalizable to missions in other host countries.
- Channel limitation: Only phone and email were assessed. Other contact channels, such as walk-in services, online portals, or social media, were not included.
- Contact information accuracy: If officially listed contact details were outdated or incorrect, this would affect the ability to reach missions but would also represent a form of inaccessibility in itself.
- Causal inference: This study measures accessibility outcomes but does not establish the reasons behind non-responsiveness. Structural, staffing, and resource factors are discussed as possible explanations but are not tested directly.
4. Results and Findings
Overall Responsiveness Across 20 Missions
Table 1 presents the email response rate, call answer rate, and composite accessibility score for each of the 20 missions included in the study.
Table 1: Composite Accessibility Scores for 20 African Diplomatic Missions in the United States
| Country | Email Response Rate | Call Answer Rate | Composite Score |
|---|---|---|---|
| Egypt | 100% | 33% | 66.5% |
| Kenya | 33% | 100% | 66.7% |
| Ethiopia | 100% | 0% | 50.0% |
| Uganda | 0% | 100% | 50.0% |
| Côte d’Ivoire | 67% | 33% | 49.8% |
| Tanzania | 33% | 59% | 46.0% |
| Sudan | 33% | 33% | 33.3% |
| Rwanda | 33% | 33% | 33.2% |
| Algeria | 33% | 33% | 33.2% |
| Congo | 50% | 0% | 25.0% |
| Morocco | 0% | 33% | 16.5% |
| Botswana | 0% | 33% | 16.5% |
| South Africa | 20% | 0% | 10.0% |
| Ghana | 0% | 0% | 0.0% |
| Nigeria | 0% | 0% | 0.0% |
| Tunisia | 0% | 0% | 0.0% |
| Senegal | 0% | 0% | 0.0% |
| Zambia | 0% | 0% | 0.0% |
| Angola | 0% | 0% | 0.0% |
| Cameroon | 0% | 0% | 0.0% |
Note: Cells highlighted in red indicate missions with zero composite accessibility scores.
Across the full sample, fewer than half of the missions responded successfully on the first contact attempt.
Top Performers
First-Contact Response Performance of Sampled Diplomatic Missions
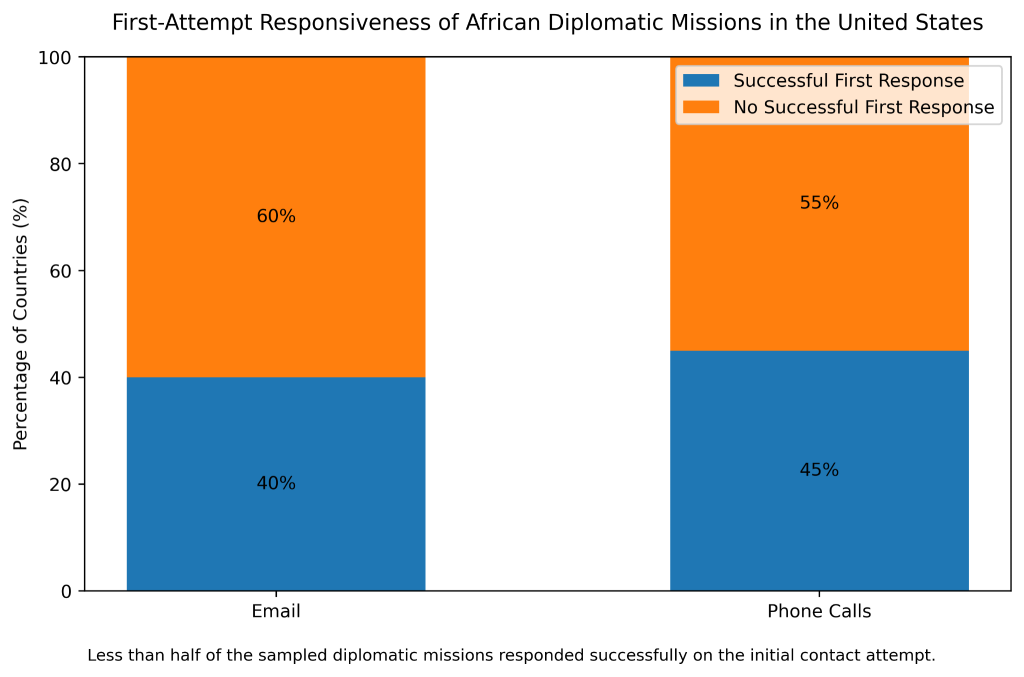
Out of the 20 countries sampled, only 8 recorded a successful response on the first email attempt, representing a first-attempt email success rate of 40%. For phone calls, 9 countries answered on the first attempt, resulting in a first-attempt call success rate of 45%. Overall, fewer than half of the sampled diplomatic missions responded successfully on the initial contact attempt, pointing to noticeable gaps in immediate accessibility and responsiveness for citizens seeking assistance or information
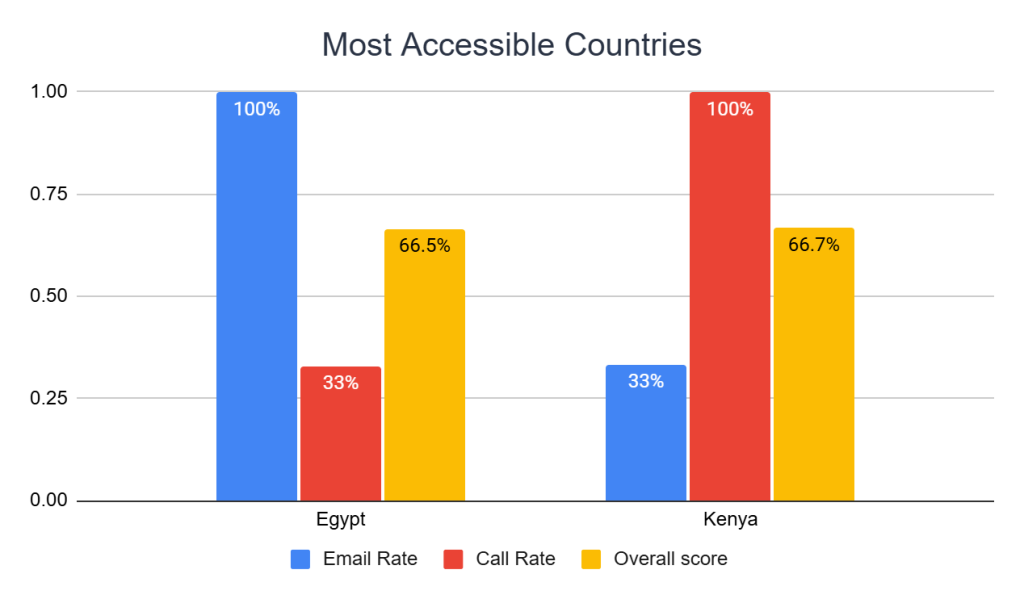
Egypt and Kenya recorded the highest composite scores, both above 66%. Egypt achieved a perfect email response rate of 100% but more limited call responsiveness at 33%. Kenya showed the reverse: 100% call answer rate but only 33% email engagement. Despite their differing channel strengths, both demonstrate a functional level of accessibility across at least one primary communication mode.
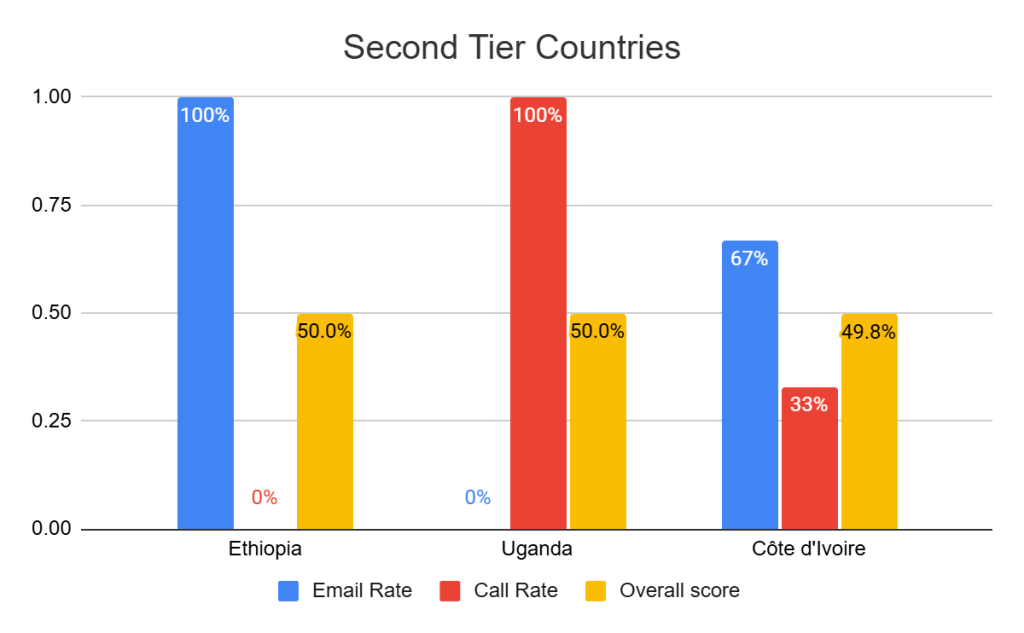
A second tier of performers includes Ethiopia, Uganda, and Côte d’Ivoire, each scoring approximately 50%. Ethiopia and Uganda mirror the Egypt-Kenya pattern at a lower level, one excelling on email, the other on calls, with notable gaps in the non-dominant channel. Côte d’Ivoire presents a more balanced profile with 67% email and 33% call responsiveness.
Moderate and Inconsistent Performers
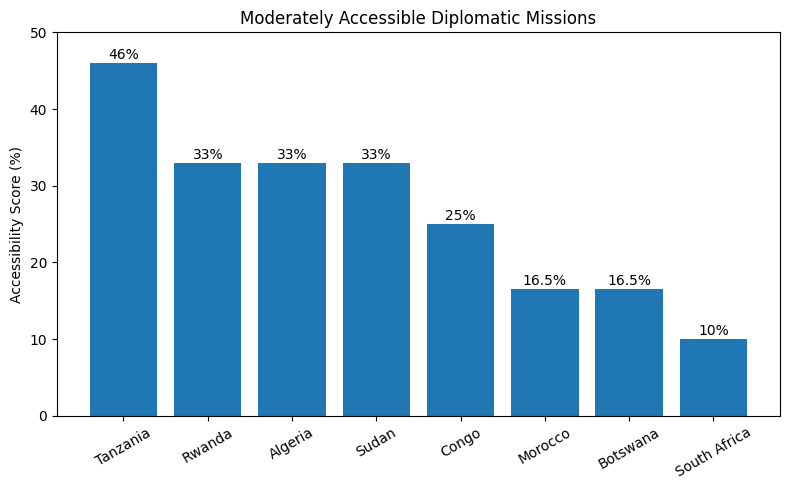
Tanzania (46%), Rwanda, Algeria, and Sudan (each at approximately 33%), Congo (25%), Morocco and Botswana (16.5%), and South Africa (10%) form a middle tier of partial accessibility. These missions respond intermittently but not consistently enough to be considered reliably reachable. In most cases, responses require repeated contact attempts.
South Africa’s performance is particularly notable: a 20% email response rate alongside 0% call responsiveness suggests a fragmented and unreliable communication setup. Morocco showed the inverse, with no email replies but partial phone accessibility.
Zero-Responsiveness Missions
Seven missions, Ghana, Nigeria, Tunisia, Senegal, Zambia, Angola, and Cameroon, recorded 0% composite accessibility scores. Despite repeated contact attempts through officially listed channels, no responses were received via email or phone during the observation period.
This represents 35% of the sampled missions. For citizens attempting to reach these embassies, the experience is not one of delay. It is one of complete silence.
5. Supplementary Assessment: Ghanaian Missions Abroad
As part of a parallel component of this study, 10 Ghanaian diplomatic missions across 10 countries were assessed using the same methodology: standardised email inquiries and phone calls directed to officially listed contact details, with a five-working-day observation window.
The countries included were: the United Kingdom, Germany, France, Italy, Belgium, the Netherlands, China, South Africa, Japan, and Australia.
Table 2: Responsiveness of Ghanaian Diplomatic Missions Across 10 Countries
| Mission | Email Response | Call Response | Outcome |
|---|---|---|---|
| United Kingdom | Yes | Yes | Both channels |
| Japan | Yes | Yes | Both channels |
| Australia | Yes | No | Email only |
| Netherlands | No | Yes | Phone only |
| Germany | No | No | No response |
| France | No | No | No response |
| Italy | No | No | No response |
| Belgium | No | No | No response |
| China | No | No | No response |
| South Africa | No | No | No response |
Three missions responded to email inquiries (United Kingdom, Japan, Australia), producing an email response rate of 30%. Three missions answered phone calls (United Kingdom, Netherlands, Japan), yielding a call response rate of 30%. Only four of the ten missions demonstrated responsiveness through at least one channel. The UK and Japan were the only missions accessible through both.
Six missions, Germany, France, Italy, Belgium, China, and South Africa, failed to respond to either inquiry form within the observation window. Notably, this includes some of the world’s most significant international destinations, suggesting that geographic prominence does not translate automatically into operational accessibility.
These findings indicate that accessibility challenges observed in Ghanaian missions within the United States are not isolated. They appear to extend across the mission network globally, pointing to systemic rather than location-specific factors.
6. Discussion
The findings of this study point to a widespread and significant gap between the institutional presence of African diplomatic missions and their functional accessibility to the people they are designed to serve.
The variation in performance across countries suggests that low responsiveness is not an inevitable feature of African diplomacy. Egypt, Kenya, and to a lesser extent Ethiopia and Uganda, demonstrate that meaningful accessibility is achievable, even within the same resource environment that appears to constrain others. This variation points away from a purely structural explanation and towards factors such as internal management, communication protocols, and institutional accountability.
The seven missions that recorded zero responsiveness raise the most serious concerns. A score of 0% does not simply indicate poor service. It indicates a complete failure to function as an accessible institution. For diaspora communities, travelers in need of urgent assistance, or individuals with time-sensitive visa requirements, the consequences of this failure are real and potentially serious.
The persistence dimension of the findings is equally important. In several cases, responses were received only after multiple follow-up attempts. This pattern suggests that even responsive missions do not always meet a standard of prompt or first-contact accessibility. The burden of persistent follow-up falls on the citizen, not the institution.
Compared to findings from broader e-governance literature, which has consistently highlighted the gap between Africa’s growing digital capacity and its public sector responsiveness, these results appear consistent with a wider pattern. The absence of accountability mechanisms, rather than a lack of technical capability, may be a key driver of poor performance.
7. Recommendations
The following recommendations are grounded directly in the findings of this study and are targeted at the institutions and stakeholders best positioned to act on them.
- Establish and publish minimum response time standards. Missions should commit to specific, publicly stated response windows for both email and phone inquiries. Publishing these standards creates a baseline for public accountability.
- Conduct regular internal accessibility audits. Foreign affairs ministries should introduce periodic testing of their missions’ responsiveness, using a methodology similar to the one employed in this study, to identify and address gaps before they are flagged externally.
- Review and regularly update published contact information. Outdated phone numbers and inactive email addresses are a basic but significant barrier to accessibility. Contact details should be verified and updated on a defined schedule.
- Use this index as a baseline for longitudinal tracking. The ADAI methodology is replicable and can be applied periodically to measure whether accessibility is improving or declining over time. Civil society organisations and research institutions are encouraged to conduct follow-up assessments.
8. Conclusion
The African Diplomatic Accessibility Index does more than produce a ranking. It provides a direct measure of whether African states are meeting a basic obligation to the people they represent abroad.
The findings indicate that this obligation is being met inconsistently, and in a significant number of cases, not at all. Seven of the twenty missions assessed could not be reached through any officially listed communication channel during the study period. This is not a question of limited resources in isolation. It is a question of priorities, systems, and accountability.
At the same time, the variation in performance shows that improvement is possible without sweeping institutional reform. Countries that perform well do so within the same broad resource environment as those that do not. The difference, this study suggests, lies in the attention given to accessibility as a function worth measuring, maintaining, and improving.
Being present is not the same as being accessible. A mission that cannot be reached cannot serve. The starting point for change is simple: answer the phone. Reply to the email. Be there when citizens need you.
References
Hamilton, K., & Langhorne, R. (2011). The Practice of Diplomacy: Its Evolution, Theory and Administration (2nd ed.). Routledge.
Heeks, R. (2002). e-Government in Africa: Promise and practice. Information Polity, 7(2–3), 97–114.
Ndou, V. (2004). E-Government for developing countries: Opportunities and challenges. Electronic Journal on Information Systems in Developing Countries, 18(1), 1–24.