



Abstract
Railways moved the raw materials that built modern industrial economies, and this study asks a simple question about Ghana: is the network it has today big enough, and working well enough, to do the same job now? We built the study around five objectives set out below, using World Bank data, national rail authority records, peer-reviewed transport-economics research, and industry reports rather than opinion. What we found is that Ghana’s railway, once you strip away the historical 1,300 km of narrow-gauge track and look only at what actually runs trains today, comes to roughly 270 to 290 km, a bit less than a third of what was operating in 1960 . Over the same stretch of decades, Ghana’s road network more than doubled and its population grew fivefold. Measured against nine comparator countries (Nigeria, Côte d’Ivoire and Senegal in West Africa; Germany, the United States, Canada, the United Kingdom, Sweden and Australia among industrialized economies), Ghana’s built network holds its own on paper but its usable network does not. A rail corridor moving freight instead of road can plausibly cut the cost of a shipment by roughly two-thirds on Ghana’s main domestic routes. The relationship between rail infrastructure and GDP, industrial output and trade turns out to be genuine but inconsistent across countries; the strongest single piece of evidence anywhere in this study for that relationship is Ghana’s own colonial cocoa boom. We close with what the current, much smaller operating network is actually likely worth to Ghana’s economy today, separate from what an expanded network could be worth later, and a set of recommendations grounded directly in the evidence.
Introduction
Background
Railways move raw materials and finished goods cheaply, and that alone has made them a recurring engine of industrialization wherever they’ve been built at scale. In the United States, the Library of Congress’s account of the late nineteenth century credits railway expansion with tying together what had been a patchwork of regional markets into a single national one, connecting producers to buyers and giving manufacturers a reliable way to move both inputs and output. By 1900, most of the American network that still carries freight today was already in the ground.
Ghana’s story starts differently but ends up in a similar place. The colonial railway was built to move gold, cocoa and timber to the coast, not to develop the country, but Remi Jedwab and Alexander Moradi’s research (Dartmouth and George Washington University) shows it did exactly that anyway: the lines opened land to cocoa cultivation that would otherwise have stayed forest, and the towns that grew up along the tracks are still visibly shaped by that history more than a century later.
Kwame Nkrumah picked up the same logic after independence. The U.S. State Department’s Office of the Historian records that his Volta River industrial project was meant to connect bauxite mines to an aluminium smelter by rail, part of a single system built around the new Akosombo dam. That connection was never fully built, and the gap it left is still visible in Ghana’s mineral economy today.
This study asks whether Ghana’s railway infrastructure, as it stands now, is adequate to support industrialization, with the focus kept squarely on freight rather than passengers.
Research Objectives
Five objectives structure everything that follows. Each one gets its own tagged section in the Results and Discussion below, so the answer to any one of them can be found without reading the whole report.
- Objective 1: Is Ghana’s current railway network adequate for its population, geographical size and level of economic activity when compared with other countries?
- Objective 2: What impact would expanding freight rail have on the cost of transporting agricultural products, minerals, petroleum products and manufactured goods?
- Objective 3: Using engineering and economic calculations, how much fuel, transportation cost and logistics cost could be saved by moving freight by rail instead of road, and what effect could this have on the final prices of goods?
- Objective 4: Is there a measurable relationship between railway infrastructure and indicators such as GDP, industrial output, manufacturing activity or trade among selected countries?
- Objective 5: What lessons can Ghana learn from the role railways played during the industrialization of countries such as the United States, as well as from Ghana’s own railway development during the colonial era and under Kwame Nkrumah?
These aren’t academic questions for Ghana right now. New bauxite finds, a manufacturing base that’s slowly growing, and ambitions to move more of West Africa’s landlocked trade through Ghanaian ports all depend on the same thing: a cheap, reliable way to move bulk goods over long distances. Rail is the obvious candidate, and this study tests whether Ghana’s version of it can actually do the job.
Literature Review
This section works through the historical record behind Objective 5 in more depth, since the rest of the report leans on it repeatedly.
The United States: railways as market-makers
American track mileage grew from about 2,000 miles in 1850 to nearly 80,000 miles by 1877, and the Library of Congress’s history of the period credits the railroad with opening the West to settlement, creating new economic opportunity, and, most importantly for this study, tying the country into one national market instead of many regional ones. Railroads didn’t just move goods, they created demand for entirely new industries like steel and machinery by guaranteeing those industries a steady flow of customers, and they standardized pricing and scheduling in a way that let businesses plan production at a scale that hadn’t been possible before.
Colonial Ghana: railways, cocoa, and the growth of towns
Two colonial-era lines, built between 1901 and 1923, linked the coast to the mining areas and to Kumasi. Nobody built them with cocoa in mind, but falling transport costs made cocoa farming for export suddenly profitable, and Ghana became the world’s largest cocoa exporter by 1911. Jedwab and Moradi’s estimate is specific: railways were responsible for around 30 percent of Ghana’s 1927 cocoa output, worth roughly 4.5 percent of that year’s GDP, which works out to a 20 to 30 percent social return on the capital that went into building the lines. Roughly half of that surplus went to Ghanaian farmers and traders; the other half was captured by the colonial administration and expatriate firms.
This is also the best evidence anywhere in the literature for rail-driven urbanization. Cocoa farming needs labour, so people moved into new farming villages along the rail corridors, and those villages grew into trading towns. Kumasi, as the inland end of the line, and Sekondi-Takoradi, built up around the western line’s port terminus, are the clearest examples: both grew from minor posts into Ghana’s second and fourth largest cities on the strength of their position on the rail map. Jedwab and Moradi’s later research pushes the finding further forward in time, showing that places along the old colonial lines were still measurably richer in the year 2000 than otherwise similar places that the railway never reached, decades after the technology itself had been overtaken by roads. Whatever advantage the railway created, it outlived the railway.
The Nkrumah era: a plan half finished
The Volta River Project dates back to British colonial geologists in the 1920s, but Nkrumah’s government revived and reshaped it from 1951 into something bigger: a dam, a deep-water port, an aluminium smelter, worker housing, and a railway, all working together. Nkrumah’s version was explicitly about self-reliance, Ghana’s own bauxite would be turned into aluminium using the dam’s own power, rather than shipped out raw. That’s not what got built. When Ghana’s original financing partner pulled out after independence, the American firm Kaiser offered a cheaper alternative: a smaller dam and a smelter that ran on imported alumina instead, and Kaiser kept importing American bauxite well into the 1970s. The rail and port link that would have connected Ghana’s own bauxite deposits at Kibi and Nyinahin to the smelter was never built at anything like the scale the original plan called for, and Ghana’s current Railway Master Plan still includes a Kibi connection today, seventy years later, essentially finishing a job that was shelved in the 1950s.
A second unbuilt line tells a similar story. Plans to extend the network north from Kumasi toward Tamale, Bolgatanga and Paga have surfaced on and off since the colonial period and still haven’t been built; the current Master Plan calls it the 595 km “Central Spine.” Given how strongly the colonial evidence links rail access to agricultural growth and town-building in the south, a century of missing connectivity in the north is a reasonable, if not fully provable, part of the explanation for why the development gap between southern and northern Ghana has persisted this long.
The post-independence decline
The most detailed academic account of what happened to Ghana’s railway after independence is Obeng et al. (2022), published in Transportation Engineering, which tracks Ghana’s rail sector against Nigeria, Kenya, South Africa, Germany and the United Kingdom on line effectiveness, freight and passenger volumes, and population access. Their figures anchor most of the operational-network numbers used throughout this report.
Methodology
Data sources
This is a desk-based research synthesis built from secondary sources; we did not run surveys, interviews, or collect primary data. We drew on five kinds of source: national rail and transport authorities, chiefly Ghana’s Railway Development Authority (GRDA) and Railway Company Limited (GRCL); international statistical databases, chiefly the World Bank’s World Development Indicators and the International Union of Railways’ Railisa database; peer-reviewed academic literature, chiefly Jedwab and Moradi on colonial Ghanaian railroads and Obeng et al. on Ghana’s railway service delivery; industry and government reports, including the Digital Logistics Capacity Assessment for Ghana, the Australasian Railway Association’s Value of Rail 2025 report, the Railway Industry Association’s Economic Contribution of UK Rail report, and the Association of American Railroads’ own current fact sheets and economic impact publications; and current news reporting used to confirm the status of specific Ghanaian rail projects. Every GDP figure used in this report was checked directly against the World Bank’s World Development Indicators database (series NY.GDP.MKTP.CD), accessed via the Federal Reserve Bank of St. Louis’s FRED database, which mirrors World Bank data with full source citation.
Country sample
We compared Ghana against two groups of countries, chosen for what they illustrate rather than through random sampling. Nigeria, Côte d’Ivoire and Senegal are Ghana’s immediate West African peers, sharing comparable income levels and the same colonial-era rail origins. Germany, the United States, Canada, the United Kingdom, Sweden and Australia represent industrialized economies with well-established rail systems, chosen to cover both continental, freight-heavy networks (the United States, Canada, Australia, structurally closer to what a mineral-and-agriculture exporter like Ghana might eventually build toward) and dense, mixed passenger-and-freight systems (Germany, the United Kingdom, Sweden).
Analytical approach
The analysis is descriptive and comparative. We calculated density ratios (rail-km per million people, per 1,000 km² of land, per US$ billion of GDP) directly from the source figures reported below, and built one illustrative freight-cost model using globally cited reference tonne-kilometre costs, since Ghana does not publish a rail freight tariff. We did not run regressions or attempt causal inference; where the report discusses statistical relationships between infrastructure and growth, those are other researchers’ published findings, cited directly rather than re-estimated. The report’s limitations, including the gap between global reference costs and measured Ghanaian costs, are addressed in full in the Limitations section.
Results and Findings
What follows is organized by research objective, in order, with evidence presented first and interpretation left for the Discussion section that follows.
RESEARCH OBJECTIVE 1: Is Ghana’s current railway network adequate for its population, geographical size and level of economic activity compared with other countries?
What Ghana actually has: built network versus running network
Ghana’s narrow-gauge (1,067 mm) network was built mostly between 1898 and 1927 and never went north of Kumasi. Adding up the Western, Central and Eastern lines plus five branch lines gives a track-length total of 1,300 km. You’ll also see a figure of 947 km quoted for the same network, that’s the route-length measurement, which counts a stretch of double track once instead of twice, so the two numbers describe the same railway, not two different ones.
Route length is also where the story turns. According to Obeng et al. (2022), Ghana’s operational network shrank from the full 947 km in 1960 to just 160 km by 2020, and the share of Ghanaians with geographic access to rail service fell from 29.6 percent to 0.6 percent over the same period. “Built but not usable” isn’t a figure of speech here, it describes track where the rails, sleepers and bridges are still physically in place but have degraded past the point where a train can safely run: missing or corroded rail, rotted sleepers, washed-out ballast, bridges nobody has inspected in years. Two things have changed since 2020, though both are more complicated on the ground than a single opening date suggests. The 96.7 km Tema to Mpakadan standard-gauge line, funded through an Exim Bank of India credit facility, was ceremonially inaugurated by then-President Nana Akufo-Addo on 22 November 2024, but the line then sat largely inactive for most of 2025, with Ghanaian media reporting it still dormant six months after that ceremony; commercial passenger service finally began in October 2025, according to the Ghana Railway Development Authority’s own account of the launch, while cargo operations were still being structured under a planned “open access” model for private freight operators as of the most recent reporting available, with GRDA targeting full commercial operation, freight included, by mid-2026. And the 15 km Kojokrom to Sekondi to Takoradi commuter line came back into service in April 2026 after rehabilitation. Add the pre-existing Tema-Accra commuter run and Ghana’s current operational total, on the passenger side, lands somewhere between 270 and 290 km, shown in Figure 1; freight movement on the new standard-gauge segment specifically should be treated as not yet fully established rather than running at capacity.
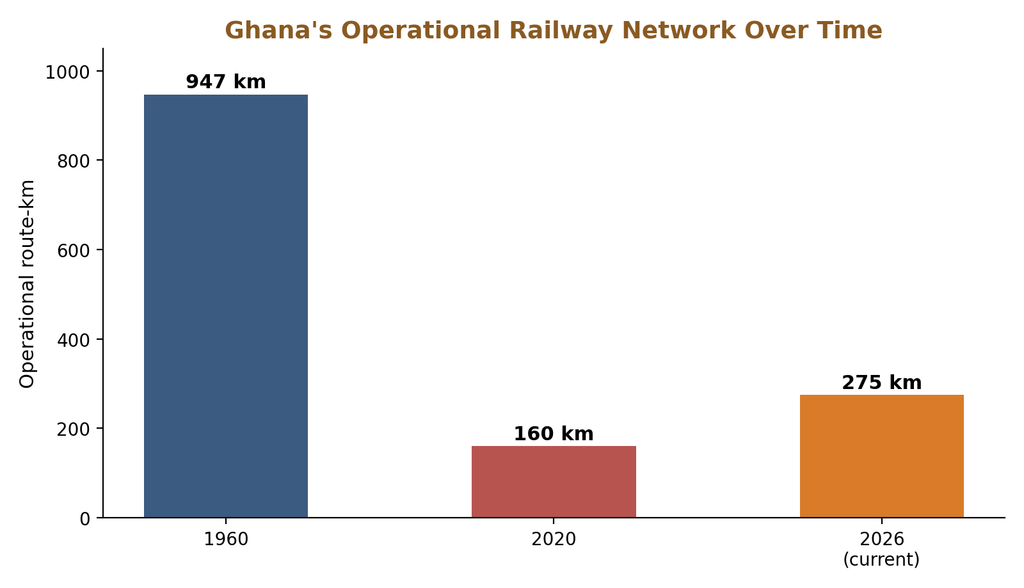
Figure 1. Ghana’s operational (usable) railway network, 1960 to 2026. Sources: Obeng et al. (2022) for 1960 and 2020; Ghana Railway Development Authority and current rail-industry reporting for 2026. The 2026 total counts the Tema-Mpakadan line on the strength of its passenger service, launched October 2025; freight service on that line is still being organized under GRDA’s open-access model as of the most recent reporting available.
How Ghana stacks up against its West African neighbours
Table 1 sets Ghana’s numbers against Nigeria, Côte d’Ivoire and Senegal, using each country’s built or route-length network, current population and land area, and GDP figures checked directly against World Bank data.
| Country | Rail km | Population, millions | Land area, km² | GDP nominal, US$ bn (World Bank) | Rail km per million people | Rail km per 1,000 km² |
| Ghana | 1,300 | 35.0 | 238,533 | 82.3 | 37.1 | 5.4 |
| Nigeria | 4,174 | 224 | 923,769 | 290.8 | 18.6 | 4.5 |
| Côte d’Ivoire | 660 | ~29-31 | 322,463 | 87.1 | ~21-23 | 2.0 |
| Senegal | 638 | ~18 | 196,722 | 32.8 | ~35 | 3.2 |
Table 1. West African railway density comparison, built/route-km basis. Rail-km from World Bank IS.RRS.TOTL.KM and national rail authorities. GDP figures are World Bank NY.GDP.MKTP.CD (Ghana and Côte d’Ivoire: 2024; Senegal: 2024; Nigeria: 2025). Nigeria’s nominal GDP has swung sharply in recent years, from $647bn in 2022 to $252bn in 2024 to $291bn in 2025, reflecting naira devaluation rather than a change in the underlying economy; the 2025 figure is used here as the most current.
On paper, Ghana looks roughly comparable to, or slightly ahead of, Nigeria and Senegal per capita. That comparison flatters Ghana, because it’s measuring track that was built, not track that runs. Swap in the operational figure and Ghana drops to around 8 km per million people and 1.1 km per 1,000 km², worse than all three neighbours, since Nigeria, Senegal and Côte d’Ivoire each keep more of their historic network in some form of active use than Ghana currently does.
How Ghana stacks up against industrialized rail systems
Table 2 extends the same comparison to Germany and five industrialized economies chosen to span both continental, freight-heavy systems and dense, mixed passenger-and-freight ones.
| Country | Rail km | Population, millions | Land area, km² | GDP nominal, US$ bn (World Bank) | Rail km per million people | Rail km per 1,000 km² |
| Germany | 33,401 | 83.5 | 357,022 | 5,050.9 | 400.2 | 93.6 |
| United States | 150,462 | ~340 | 9,147,593 | 30,769.7 | 442.5 | 16.5 |
| Canada | 49,422 | 41.5 | 9,093,507 | 2,319.9 | 1,190.9 | 5.4 |
| United Kingdom | 15,849 | 69.3 | 241,930 | 4,002.6 | 228.7 | 65.5 |
| Sweden | 9,714 | 10.6 | 410,335 | 669.0 | 916.4 | 23.7 |
| Australia | ~32,000 | 27.5 | 7,741,220 | 1,757.0 | 1,163.6 | 4.1 |
Table 2. Industrialized-economy railway density comparison, built/route-km basis. Rail-km from World Bank IS.RRS.TOTL.KM, Deutsche Bahn network statistics, and the Australasian Railway Association’s 2025 figure of “over 31,000 km” for Australia. GDP figures are World Bank NY.GDP.MKTP.CD, most recent year available per country (2025 for Germany, the United States, Canada, the United Kingdom and Sweden; 2024 for Australia).
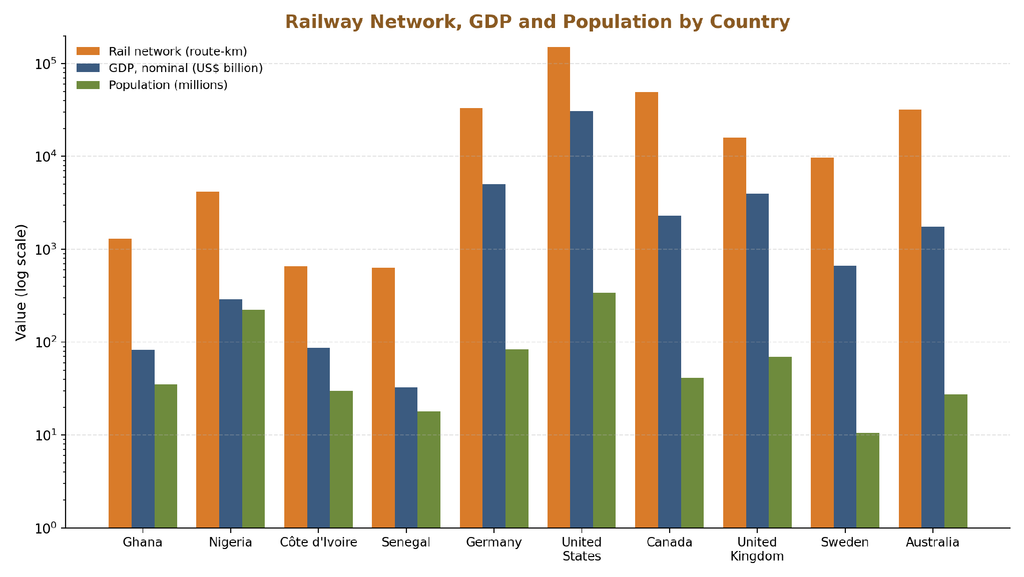
Figure 2. Railway network length (route-km), nominal GDP (World Bank, US$ billion), and population (millions) by country, log scale, covering all nine comparators from Tables 1 and 2.
Three things stand out. First, rail kilometres per billion dollars of GDP puts Ghana at 15.8, ahead of the United Kingdom’s 3.96 and the United States’ 4.89, though behind Canada’s 21.3 and Australia’s 18.2. That looks good for Ghana until you remember why: Ghana’s economy is small relative to its historic track length, not because its usable network is doing comparable work. Second, on a per-person basis Ghana’s 37.1 km per million people is an order of magnitude behind Sweden (916), Canada (1,191) and Australia (1,164). Third, and this is the finding that matters most for Objective 1, every industrialized country in Table 2 keeps the great majority of its built network running, while Ghana operates roughly a bit less than a third of what was built. The built-network ratios above actually understate how big the adequacy gap is once you account for what’s actually usable. Taken together, Ghana’s railway network is not adequate for its population, land area, or level of economic activity against any comparator in this study, once operational status rather than historical construction is the basis for comparison.
RESEARCH OBJECTIVE 2: What impact would expanding freight rail have on the cost of transporting agricultural products, minerals, petroleum products and manufactured goods?
The one real Ghanaian bulk-freight number we have
The Volta Lake Transport Company (VLTC) moves bulk cement and fuel by barge, not rail, but it’s the closest thing Ghana has to a currently operating, price-regulated bulk inland freight alternative to road. VLTC charges GH¢48.40 per tonne for a 415 km haul, a rate the Digital Logistics Capacity Assessment for Ghana describes as comparing favourably with what the cement producer GHACEM pays road hauliers for a shorter 721 km trip. VLTC’s fuel tariff is set by the National Petroleum Authority at 60 percent of the approved Bulk Road Vehicle rate, and each VLTC trip is reported to take the equivalent of 50 articulated trucks off the road.
What this could mean, sector by sector
- Agriculture (cocoa and food crops): the colonial evidence is the strongest case anywhere in the literature that rail access turns subsistence farming into export agriculture, since that’s exactly what happened to cocoa between 1900 and 1927. Extending rail into growing regions that currently have none would be expected to lower the delivered cost of cocoa and food crops, though the effect today would likely be smaller than the colonial-era one, since farmers now have a road alternative that didn’t exist in 1910.
- Mining (bauxite, manganese, gold): GRCL already hauls bauxite and manganese on the Western line, and the new bauxite finds at Kibi are one reason GRDA’s consultant is revising the 2013 Master Plan. Bulk minerals are where rail’s cost advantage over road shows up most consistently in the literature, because minerals are dense, low-value-per-tonne cargo that doesn’t need the speed advantage road retains for higher-value goods.
- Petroleum products: Ghana currently moves fuel almost entirely by road (Bulk Road Vehicle) and by VLTC’s lake barges to inland depots. No dedicated rail fuel corridor exists yet, so we could not build a rail-versus-road comparison for this commodity from public data. It’s the one gap in this section worth flagging directly.
- Manufacturing: Ghana’s manufacturing base sits mostly around Accra-Tema, Kumasi and, to a lesser extent, Takoradi, all of which the current and planned rail corridors already reach. The likely benefit here is cheaper delivered inputs rather than new market access, since Ghana’s manufacturers aren’t yet producing the kind of high-volume bulk exports that benefit most directly from rail.
- Trade (regional and port-linked): the Tema-Mpakadan line and the planned Ghana-Burkina Faso interconnectivity project speak directly to this. When Côte d’Ivoire’s civil war disrupted its ports in the early 2000s, transit trade through Tema jumped from 20,000 tonnes in 1999 to over 700,000 tonnes within four years, almost entirely by road. That single episode shows both how much transit trade is up for grabs and how much road damage comes from carrying it without rail capacity.
None of the sector-level effects above can be put into hard Ghanaian numbers yet. Ghana Statistical Service’s transport and trade statistics, COCOBOD’s internal haulage records, and the Minerals Commission’s export logistics data would each need to be pulled directly to turn this section from a reasoned argument into a quantified one.
RESEARCH OBJECTIVE 3: How much fuel, transportation cost and logistics cost could be saved by moving freight by rail instead of road, and what effect could this have on the final prices of goods?
The engineering case
According to the Association of American Railroads’ current published figures, a single freight train can replace several hundred trucks on the road, and railroads are, on average, three to four times more fuel-efficient than trucks, moving a ton of freight nearly 500 miles on a single gallon of diesel. Over distances beyond 1,000 km, commonly cited reference costs put rail freight at around US$0.04 per tonne-km against roughly US$0.12 per tonne-km for road, a threefold gap consistent with that fuel-efficiency advantage.
What that means on Ghanaian corridors
Ghana doesn’t publish a rail freight tariff, so we applied these reference rates to two real Ghanaian corridors: the roughly 210 km Kumasi to Takoradi route, and the 415 km distance VLTC already uses as its own benchmark haul. Figure 3 shows the result for a 10,000-tonne shipment moved each way. On the shorter corridor, road costs about US$252,000 against roughly US$84,000 by rail, cutting the cost by about two-thirds. On the longer corridor, road runs about US$498,000 against roughly US$166,000 by rail. These are built from global reference rates, not Ghanaian fuel prices, wages or track-access charges, and GRCL’s own tariffs, once published, should replace them.
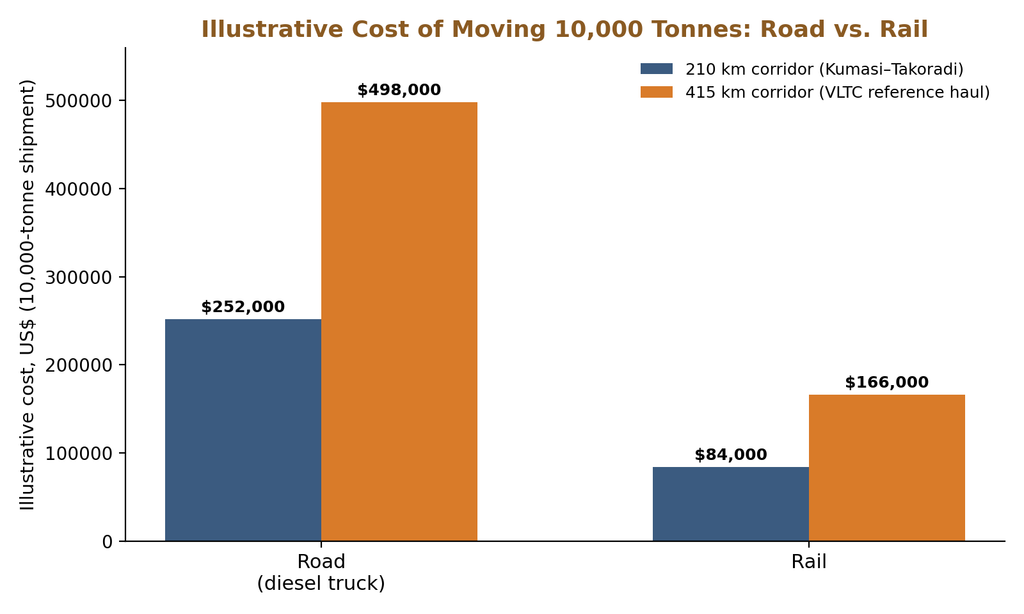
Figure 3. Cost of moving a 10,000-tonne shipment by road versus rail, using reference tonne-km rates (US$0.12/tonne-km road, US$0.04/tonne-km rail) applied to two Ghanaian corridors.
What it means for the price of goods
Transport cost feeds straight into the delivered price of anything shipped in bulk, and Ghana’s own numbers say there’s real room to bring that cost down. According to the World Bank’s 2022 Logistics Performance Index, Ghana scores 2.5 out of 5 overall, with the trade-and-transport-infrastructure sub-score at 2.4, both below the global mid-point. A cheaper freight mode would be expected to show up in lower prices for food, fuel, cement and other bulk goods moved the 200 to 400 km that separates Ghana’s production zones from Accra, Tema and Takoradi. VLTC is a small piece of direct evidence for this already: a regulated bulk carrier undercutting road hauliers on a comparable route while pulling trucks off that road. What’s missing is a Ghana-specific study connecting transport cost directly to retail prices for cocoa, maize, cement or fuel, which is the single most useful thing a follow-up study could add here, built from Ghana Statistical Service’s price indices read alongside Ghana Highway Authority road-condition data and NPA fuel pricing.
RESEARCH OBJECTIVE 4: Is there a measurable relationship between railway infrastructure and GDP, industrial output, manufacturing activity or trade among selected countries?
What the cross-country evidence actually shows
The honest answer is: it depends which countries and which years you look at. A panel study covering South Africa, Botswana, Ghana, Namibia, Kenya, Nigeria, Zambia, The Gambia, Angola and Ethiopia found transport infrastructure had a negative, statistically insignificant relationship with growth, while electricity and water-and-sanitation infrastructure were both positively and significantly linked to it in the same sample. A separate, broader African panel study using dynamic system GMM estimation found the opposite for transport specifically, both aggregate and disaggregated infrastructure indices, transport included, came out positively associated with GDP per capita growth. A Kenya-specific time-series study found rail and GDP were both stationary at level, which distinguishes rail’s relationship with Kenyan growth from other infrastructure variables in that dataset, though stationarity alone doesn’t tell you the direction or size of any effect.
Ghana and Nigeria’s decline against the industrialized world’s growth
Here the comparison sharpens considerably. According to Obeng et al. (2022), Ghana’s rail-line effectiveness fell from 68 percent in 1980 to 16.9 percent in 2020, the steepest decline of the six countries in their study. Ghana and Nigeria both saw freight volumes drop by 81 percent between 1990 and 2020, while South Africa, Germany and the United Kingdom moved the other way, adding an average of roughly 100,000 million tonne-km of freight a year over the same period. Figure 4 puts Ghana and Nigeria’s decline side by side.
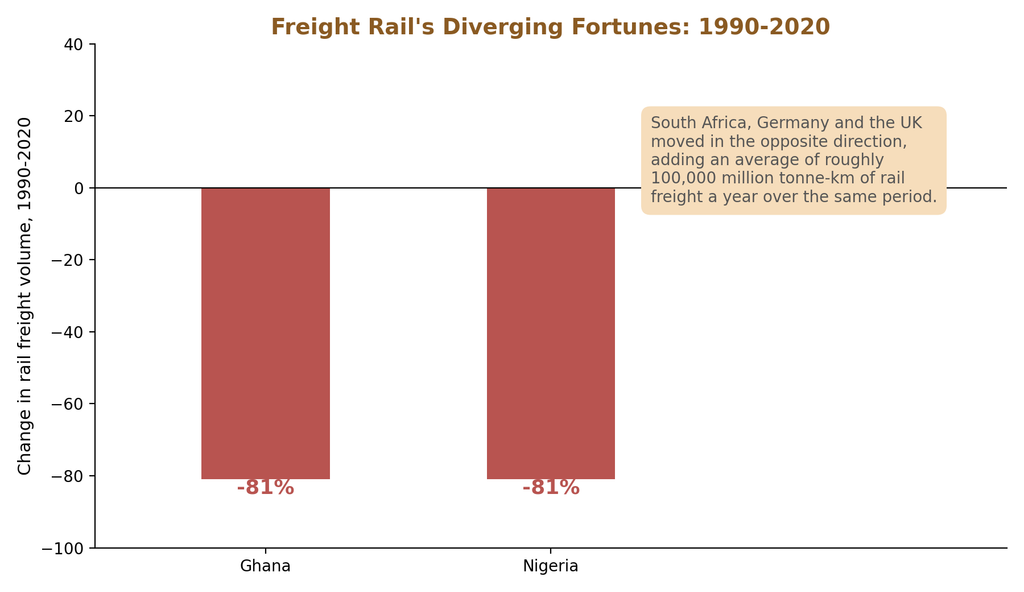
Figure 4. Change in rail freight volume, Ghana and Nigeria, 1990 to 2020. Source: Obeng et al. (2022).
This divergence tracks, loosely, with the two groups’ broader industrial paths. Germany’s roughly 33,400 km network carries 116 to 127 billion tonne-km of freight a year and sits under one of the world’s largest manufacturing sectors; Ghana’s operational network is smaller than the catchment area of some individual German freight yards, and Ghanaian manufacturing remains a modest share of GDP. We’re not claiming rail caused that gap on its own, capital stock, energy supply, skills and decades of accumulated investment all matter enormously too, but the density and reliability of freight rail is one of the few infrastructure variables where the gap between Ghana and Germany is measured in multiples of ten rather than multiples of two.
What Ghana’s current railway is actually worth to the economy
This is worth working out carefully, because a top-down estimate (taking the share of GDP that rail contributes in a mature rail economy and applying it to Ghana’s whole $82.3 billion economy) overstates what a 275 km operating stretch, most of it brand new, could plausibly be generating right now. A better approach starts from what mature rail systems earn per kilometre of track that’s actually running, then applies that rate only to the kilometres Ghana actually has in service.
According to the Australasian Railway Association’s 2025 report, Australia’s rail sector generated AU$38.8 billion in total economic contribution in 2024 across a network of roughly 31,000 km, which works out to about AU$1.25 million, or roughly US$901,000, per kilometre at current exchange rates. The Association of American Railroads puts the U.S. figure at US$233.4 billion in 2023 across a freight network of about 225,000 km, or roughly US$1.04 million per kilometre. Applying that per-kilometre range to Ghana’s approximately 275 operating kilometres gives a plausible current economic contribution of somewhere between US$250 million and US$285 million a year, an order of magnitude smaller than a whole-economy percentage estimate would suggest, and a figure that should grow automatically as more of the Master Plan’s lines come into service, without needing the rest of the economy to grow at all.
We can check this against something more concrete: what Ghana’s railway is actually charging passengers today. GRDA’s own launch pricing for the Tema-Mpakadan line, reported by Graphic Online in October 2025, sets fares at GH¢15 for Tema to Afienya, GH¢25 for Afienya to Adorme, and GH¢40 for the full Tema-Adorme run, with the Tema-Accra commuter service priced at a flat GH¢15. Troski.me’s live schedule data shows the Tema-Mpakadan line running about two return trips a day, six days a week. Assuming a modest 120-seat train, a conservative 50 percent load factor, and roughly 300 operating days a year, all three of Ghana’s current passenger services together bring in somewhere in the neighbourhood of US$300,000 a year in fare revenue. That’s a genuinely small number next to the US$250 to US$285 million broader economic-contribution estimate above, and the gap between them is the point: fare revenue is one narrow slice of what a railway is worth to an economy, freight (once it’s actually running on the new line), employment, supply chains and the ripple effects of cheaper logistics are the rest, and none of the current three passenger services were built with volume in mind.
Table 3 lays out both the current picture and, separately, what a fully built Master Plan network (4,008 km) could theoretically be worth if it eventually reached the same per-kilometre productivity as Australia’s or the United States’ mature systems, alongside a passenger-fare-only projection scaled to a much busier, multi-line network. The second column is a ceiling for a mature system decades from now, not a near-term forecast, and we’ve kept it clearly separate from the current-network figures for that reason.
| Measure | Current (~275 operating km) | If fully built (4,008 km, mature system) |
| Broad economic contribution (freight, employment, supply chain, multiplier effects), per year | US$250-285 million | US$3.6-4.2 billion |
| Passenger fare revenue alone, per year | ~US$300,000 | ~US$4-5 million |
Table 3. Ghana rail economic contribution, current operating network versus a fully built, mature Master Plan network. Current-network figures scale Australian and U.S. rail-sector contribution per operating kilometre to Ghana’s roughly 275 operating km; the fully-built figures apply the same per-kilometre rates to the Master Plan’s full 4,008 km as a long-run ceiling. Passenger fare figures are built from GRDA’s published Tema-Mpakadan and Tema-Accra fares under stated frequency and load assumptions, not measured ridership.
RESEARCH OBJECTIVE 5: What lessons can Ghana learn from the United States, colonial Ghana, and the Nkrumah era?
Four lessons come directly out of the history reviewed above. From the United States: rail’s payoff compounds when it’s allowed to standardize markets and pull whole new industries into being, not just move freight from A to B. From colonial Ghana: rail access turns latent agricultural and mineral potential into cash income, and the effect outlasts the infrastructure itself by generations, which is the strongest single argument for finally building the northern extension that every government since the colonial era has proposed and shelved. From the Nkrumah era: choosing the cheaper, import-dependent version of an industrial plan over the more expensive, self-reliant one has costs that compound for decades, Ghana is still importing alumina for its one smelter and still hasn’t built the rail link to its own Kibi and Nyinahin bauxite. And from the contrast between Germany’s sustained reinvestment and Ghana’s post-1970s experience: what separates a railway that gets more useful over time from one that decays back to a road-only baseline isn’t the initial construction, it’s whether anyone keeps paying to maintain it.
Discussion
Why is rail effectiveness declining while roads expand and population grows?
This deserves to be stated plainly, because the obvious expectation, that more people and more economic activity should support more infrastructure, not less, simply doesn’t hold for Ghanaian rail. Three things appear to be happening together. First, Ghana’s roads expanded hugely over the exact period rail collapsed: the trunk network alone reached 13,367 km by the Ghana Highway Authority’s own count, and Ghana’s total road network now runs to roughly 94,203 km, more than double the approximately 40,186 km on record as recently as 2013. That timing lines up closely with Obeng et al.’s finding that rail-line effectiveness fell from 68 percent to 16.9 percent between 1980 and 2020, as shown earlier in Figure 1. Second, Ghana’s population has grown roughly fivefold since 1960, from about 6.7 million to roughly 35 million, so the 0.6 percent of the population with rail access in 2020 was a tiny and shrinking slice of a country that had otherwise grown enormously. Third, once a transport mode starts losing riders and freight, the case for maintaining it weakens on its own: falling use means falling revenue and falling political attention, which means falling maintenance, which degrades service further and pushes still more traffic onto the roads Ghana was busy expanding at the same time.
None of this means Ghanaians prefer roads to rail on principle. They use roads because rail, where it still exists at all, offers a fraction of the reach, frequency and reliability the road network provides. That points, reasonably though not conclusively, toward extending rail into Ghana’s major regions actually working: a genuinely useful, well-maintained line competes with road on cost and reliability, rather than sitting next to a road network that already covers most of what rail currently can’t. The colonial cocoa boom remains the strongest evidence available that Ghanaian demand for rail responds strongly once rail becomes available; there’s nothing in the record to suggest that response wouldn’t happen again, though a modern effect would likely be smaller than the colonial one, simply because a road alternative exists now that didn’t exist in 1910.
This also points to maintenance, not construction, as the tighter constraint. Ghana’s narrow-gauge network wasn’t badly designed, colonial engineers built something that carried 3.5 million tonnes of freight a year at its peak, shown in Figure 5. It failed because decades of underinvestment let it degrade past the point of safe use. Whatever Ghana builds next needs a funded, multi-decade maintenance commitment baked in from day one, or it risks repeating the same story.
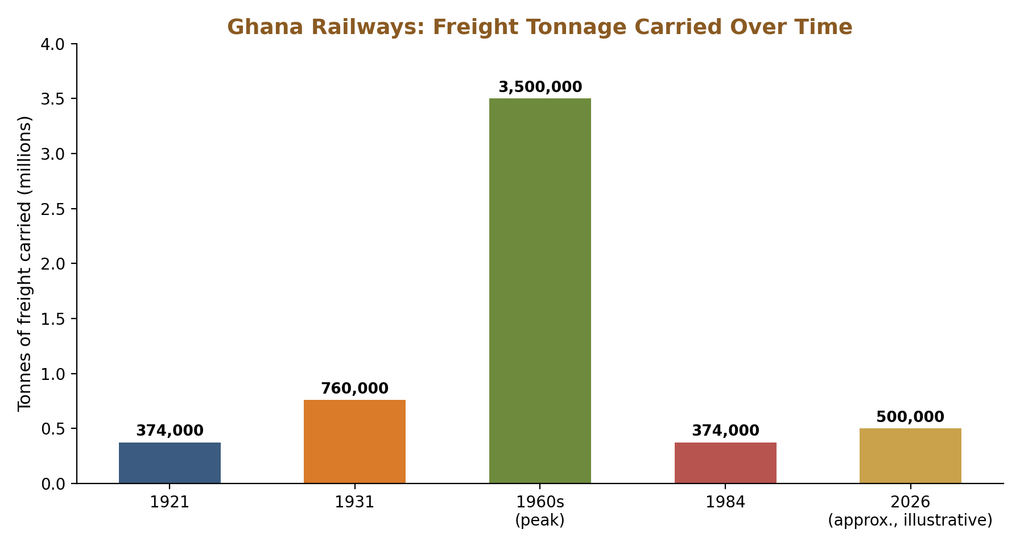
Figure 5. Ghana Railways freight tonnage carried, selected years, 1921 to 1984, with an illustrative 2026 estimate. Source: Jedwab and Moradi (2011) freight series, as cited in subsequent transport-policy literature.
How this compares with prior research, and what else could explain it
The adequacy and decline findings here track closely with Obeng et al. (2022), the closest prior academic study on this exact question. What this report adds is threefold: it widens the industrialized comparator set, works through an illustrative freight-cost model connecting the adequacy findings to actual cost savings, and ties the whole picture back to Ghana’s own colonial and Nkrumah-era history. Two other explanations for the decline are worth naming, since the road-expansion-and-neglect story above is a strong association rather than a proven cause. Ghana’s periodic debt and currency crises may simply have squeezed public infrastructure spending across the board, with rail maintenance as one casualty among many rather than a specifically targeted cut. And the mix of goods Ghana needs to move may have shifted toward cargo that suits road better as the economy diversified beyond cocoa and minerals, which would reduce rail’s advantage independent of any road competition at all. Nothing in this study’s evidence rules either explanation out.
Limitations
- Data limitations: Ghana’s current rail freight tonnage and capacity, and a comprehensive national rail-sector revenue figure for Canada and Sweden, are not published anywhere we could find; the Objective 4 revenue estimates use Australian and U.S. per-kilometre benchmarks in their place, and should be replaced with Ghanaian figures once GRDA or GRCL publish them.
- Sampling limitations: the ten-country comparator sample was chosen for geographic and economic variety, not statistical representativeness, and the cross-country growth studies discussed in the Discussion are a narrow selection from a much larger literature.
- Geographic limitations: the West African comparator set leaves out Burkina Faso and Togo, discussed narratively but not in the quantitative tables, and the industrialized comparator set includes only one Nordic country and no Asian industrialized economy.
- Methodological limitations: this is a secondary-source desk study with no primary data collection; the freight-cost model in Objective 3 uses global reference rates rather than measured Ghanaian costs; and no original statistical or econometric analysis was performed for Objective 4, which relies on other researchers’ published findings.
Recommendations
- GRDA and the Ministry of Transport should prioritize completing the Kumasi to Paga northern spine and the Takoradi to Kumasi standard-gauge upgrade, the two Master Plan components most directly supported by the Objective 1 and Objective 5 findings.
- Every new rail investment should come with a dedicated, funded, multi-decade maintenance budget approved alongside the construction budget, since this study finds Ghana’s historic decline was driven by maintenance neglect, not a flawed initial design.
- GRDA should finish structuring and launch Tema-Mpakadan’s freight operations without further delay, since the line’s economic case, and much of this report’s current-network revenue estimate, depends on cargo actually moving, not just passengers.
- GRDA and GRCL should publish current freight tonnage by commodity, current tariffs, and network condition data on a regular schedule, so the illustrative figures in Objectives 2, 3 and 4 can be replaced with measured Ghanaian numbers.
- Ghana Statistical Service, COCOBOD, and the Minerals Commission should be approached directly for transport-sector accounts, cocoa haulage volumes by mode, and mineral export logistics data respectively.
- Given how mixed the cross-country evidence is under Objective 4, Ghana’s investment case for rail should rest on its strongest and most directly relevant evidence, the colonial-era cocoa-corridor effect and the bulk-commodity corridors rail would serve today, rather than a general claim that rail investment reliably raises GDP, which the wider literature doesn’t consistently support.
References
- Library of Congress, “Railroads in the Late 19th Century,” Rise of Industrial America, 1876-1900.
- Jedwab, R. and Moradi, A., “Colonial Investments and Long-Term Development in Africa: Evidence from Ghanaian Railroads,” George Washington University / Dartmouth NEUDC working paper (Jedwab and Moradi, 2011).
- U.S. Department of State, Office of the Historian, background on the Volta River Project and Ghana-U.S. relations under Nkrumah.
- Kerby, E., Moradi, A. and Jedwab, R., “Three policy lessons from Africa’s colonial railways,” Africa at LSE / CEPR VoxEU.
- Obeng, D.A., Bessah, E., Amponsah, W., Dzisi, E.K. and Agyare, W.A., “Ghana’s railway transport services delivery: A review,” Transportation Engineering, Vol. 8, 2022.
- Ghana Railway Development Authority (GRDA), Railway Master Plan and Upcoming Projects pages, grda.gov.gh.
- Graphic Online, “GRDA activates Tema-Mpakadan rail services,” October 1, 2025 (fare structure and passenger-service launch); “Tema-Mpakadan railway inactive six months after official opening,” May 20, 2025 (status between the November 2024 inauguration and the October 2025 launch, and the June 2026 target for full commercial operation).
- Troski.me, live Ghana train schedule and fares, accessed August 2026.
- World Bank, “GDP (current US$)” indicator (NY.GDP.MKTP.CD), World Development Indicators, retrieved via the Federal Reserve Bank of St. Louis FRED database (series MKTGDPGHA646NWDB, MKTGDPNGA646NWDB, MKTGDPCIA646NWDB, MKTGDPSNA646NWDB, MKTGDPDEA646NWDB, MKTGDPUSA646NWDB, MKTGDPCAA646NWDB, MKTGDPGBA646NWDB, MKTGDPSEA646NWDB, MKTGDPAUA646NWDB).
- World Bank, “Rail lines (total route-km)” indicator (IS.RRS.TOTL.KM), World Development Indicators.
- World Bank, Ghana country overview and Logistics Performance Index data.
- Digital Logistics Capacity Assessments (Logistics Cluster), “Ghana – 2 Logistics Infrastructure” and “Ghana – 2.3 Road Network.”
- Ghana Highway Authority, agency overview (siga.gov.gh); “Roads in Ghana,” Wikipedia.
- U.S. Geological Survey, “The Mineral Industry of Ghana,” commodity review (Kibi and Nyinahin bauxite).
- National and Wikipedia-aggregated rail-network sources for Nigeria, Côte d’Ivoire, Senegal, Germany, the United States, Canada, the United Kingdom, Sweden and Australia; World Population Review, “Railroads by Country 2026.”
- Association of American Railroads (AAR), “Freight Rail Facts & Figures” (aar.org, current), “Freight Rail FAQs,” and “Rail Transportation and the U.S. Economy” economic impact report, 2025.
- Railway Industry Association (RIA) / Oxford Economics, “The Economic Contribution of UK Rail,” 2019/2021.
- Australasian Railway Association (ARA) / Deloitte Access Economics, “The Value of Rail 2025.”
- International Council on Clean Transportation, “Beyond trucks: Toward a greener global freight transportation system.”
- Panel-data and GMM studies on African infrastructure and growth, Economic Change and Restructuring (Springer); Kenya rail-GDP causality study (ScienceDirect).
- Xe and Wise currency data, GHS/USD and AUD/USD exchange rates, accessed August 2026.